Crop Water Module description
Crop water requirement will be estimated using FAO 56 method.
Step by Step Process
- The web page will have two options to select cadastral/survey number, “From List” and “From Map”. “From List” option allows user to select District, Taluk, Village, Survey Number, Crop Name, Date of Sowing.From Map” option will allow user to select XY coordinate (Lat-Long) on the map (Cadastral) which will autofill the District, Taluk, Village and Survey number values.
- User will select the District, Taluk, Village, Survey number, Crop Name, Date of Sowing
- Execute query on Master_Crop table to find out Kc value at initial stage (Kc ini), kc value at mid – season stage (Kc mid (tab)) , kc value end season stage(Kc end(tab)), mean maximum plant/crop height for mid s (h), crop duration.(As per POP for each crop and stored in the system)
- Calculate the number of days after Sowing by subtracting date of sowing from current date.
- Execute query on Weather_Data table to find out temperature, wind speed, humidity, solar radiation, sunshine hours. Calculate minimum Relative humidity (RHmin), Mean Wind speed (u2).
- If user selects initial stage time period for a particular crop, then initial crop coefficient (KCini) value for the same crop will be fetched from crop coefficient table.
- Likewise, if user selects mid stage/end stage for a particular crop, using the middle crop coefficient (KCmid (tab)) or end of the late season growth stage, end crop coefficient (KCend (tab)) value from crop coefficient table, it follows the below mentioned equation.
-
- Calculate Kc mid
![]()
Where,
Kc mid (Tab) - value for Kc mid is taken from given Table,
u2 - Mean value for daily wind speed at 2m height during the midseason growth stage [m s-1],
RHmin - mean value for daily minimum relative humidity during the mid-season growth stage [%],
h - Mean crop height during the mid-season stage [m],
- Calculate Kc end:
![]()
Where,
Kc end (Tab) - value for Kc end taken from Table
u2 - Mean value for daily wind speed at 2m height during the late-season growth stage [m s-1],
RHmin - mean value for daily minimum relative humidity during the late-season growth stage [%]
h - mean plant height during the late season stage [m]
- Mean wind speed (u2) at 2 m above ground surface will be calculated as:
![]()
Where
u2 – wind speed at 2 m above ground surface [m s-1]
uZ – measured wind speed at z m above ground surface [ms-1]
z – height of measurement above ground surface [m].
- Execute query on climate data table and calculate Net radiation (Rn), mean daily air Temperature (T)
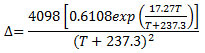
- Estimate Slope of saturation vapour pressure curve (∆) using below equation
Where,
∆ -slope of saturation vapour pressure curve at air temperature T [kPa °C-1],
T- Mean daily air temperature [°C],xp[..] - 2.7183 (base of natural logarithm) raised to the power [..]
- Estimate Soil Heat flux (G), where G for a day or ten days, it is relatively small and so it may be ignored in the calculation. Thus: Gday = 0
- Atmospheric pressure (P):
![]()
Where,
P - Atmospheric pressure [kPa],
z - Elevation above sea level [m]
- Calculate Psychrometric constant (γ):
![]()
Where,
γ - Psychrometric constant [kPa °C-1]
P - Atmospheric pressure [kPa],
- e°(Tmin) and e°(Tmax) are calculated as follows:
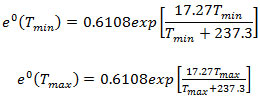
Where,
e°(Tmin) – Minimum saturation vapour pressure at the air temperature Tmin [kPa],
Tmin – Minimum air temperature [°C],
e°(Tmax) – Maximum saturation vapour pressure at the air temperature Tmin [kPa],
Tmax – Maximum air temperature [°C],
exp[..] - 2.7183 (base of natural logarithm) raised to the power [..].
- Calculate Mean saturation vapour pressure (es):
![]()
Where,
es - Mean saturation vapour pressure [kPa],
e°(Tmin) – Minimum saturation vapour pressure at the air temperature Tmin [kPa],
e°(Tmax) – Maximum saturation vapour pressure at the air temperature Tmin [kPa]
- Calculate Actual vapour pressure (ea)
![]()
Where,
ea – Actual vapour pressure [kPa]
eo (Tmin) – Saturation vapour pressure at daily minimum temperature [kPa]
eo (Tmax) – Saturation vapour pressure at daily maximum temperature [kPa]
RHmax – Maximum Relative Humidity [%]
RHmin – Minimum Relative Humidity [%]
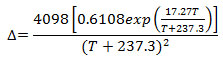
- Calculate Slope of saturation vapour pressure curve (∆)
Where,
∆ -slope of saturation vapour pressure curve at air temperature T [kPa °C-1],
T - air temperature [°C],
exp[..]- 2.7183 (base of natural logarithm) raised to the power [..].
- Calculate Potential Evapotranspiration (PET)
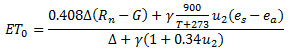
Where,
ET0 – Reference Evapotranspiration [mm day-1]
Rn – Net radiation at the crop surface [MJ m-2 day-1]
G – Soil Heat flux density [MJ m-2 day-1]
T – Mean daily air temperature at 2m height [°C]
U2 – Wind speed at 2m height [m s-1]
es – Saturation vapour pressure [k Pa]
ea – Actual vapour pressure [k Pa]
(es - ea)– Saturation vapour pressure deficit [kPa]
D - Slope vapour pressure curve [kPa °C-1]
g - Psychrometric constant [kPa °C-1]
- Calculate Crop Water Requirement (Crop Evapotranspiration (ETC)) depending on crop coefficient of selected growth stage (KC ini, KC mid or KC end)
ETc = KC ETo
Where,
ETc - Crop evapotranspiration [mm d-1],
Kc - Crop coefficient [KC ini, KC mid or KC end],
ETo - Reference crop evapotranspiration [mm d-1].
- Fetch the Geometry from the Cadastral table against the Cadastral_ID.
[Kc values, if available at different stages of growth, can be used wherever computation is not possible]. This to be provided for all the crops cultivated in the state.
- Read the Coordinates of the geometry and create GeoJson polygon. Send GeoJson to Leaflet to display the polygon with Cyan color and overlay it on the map.
- Display the result in a table showing the information such as
[Survey No, Farmer Name, Area in Hectare, Crop Name, Crop Stage (days), Water Required mm/day, Water Required in Ltr/day (mm * 10000*area)(A), Available Soil Moisture Content, Balance C =A-B].
Survey No, Farmer Name, Total Area (ha)/Acres, Crop Name, Crop Stage (days), Crop Water Requirement (mm), Crop Water Requirement (m3)
- Display the Farm owner details based on the data fetched for cadastral from result grid view through web service integration with Bhoomi.
- Custom option will allow user to temporarily change the cadastral input values or decision criteria table values for that particular user session which will help to further execute and analyze DSS results based on these temporary changes.